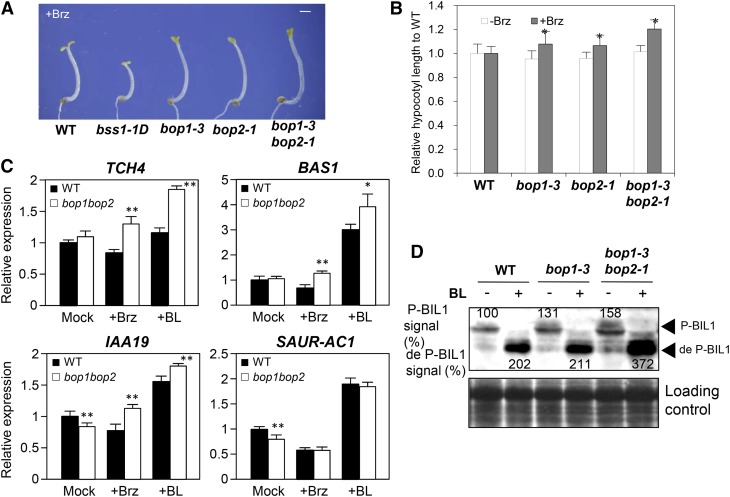
Figure 3.
BSS1/BOP1-Deficient Mutants Showed Brz Resistance and Positive Regulation for BR Signaling.
(A) Dark-grown phenotypes of wild-type, bss1-1D, and BSS1/BOP1-deficient mutant plants on medium containing DMSO or 3 μM Brz for 7 d. Bar = 1 mm.
(B) Relative hypocotyl lengths of bop1-3, bop2-1, and bop1-3 bop2-1 compared with the wild type on medium containing DMSO or 3 μM Brz after growth in the dark for 7 d. The results are presented as means ± sd (n = 34). *P < 0.05, Student’s t test.
(C) Brz and BL responsiveness of BR-regulated genes in bop1-3 bop2-1. The expression levels of TCH4, BAS1, IAA19, and SAUR-AC1 were analyzed by qRT-PCR in 9-d-old light-germinated seedlings and treated with medium containing DMSO, 3 μM Brz, or 100 nM BL for 3 h. The data represent means ± sd of four independent replications. **P < 0.01, *P < 0.05, Student’s t test.
(D) Immunoblot analysis of BIL1/BZR1 phosphorylation status of the wild type, bop1-3, and bop1-3 bop2-1. The experiment was performed as described in Figure 2B. The signal intensities of phosphorylated BIL1/BZR1 and dephosphorylated BIL1/BZR1 are shown above and below each band (arrowheads) and are presented as percentages relative to the level of phosphorylated BIL1/BZR1 in wild-type seedlings. The bottom panel shows a Ponceau S-stained gel.

