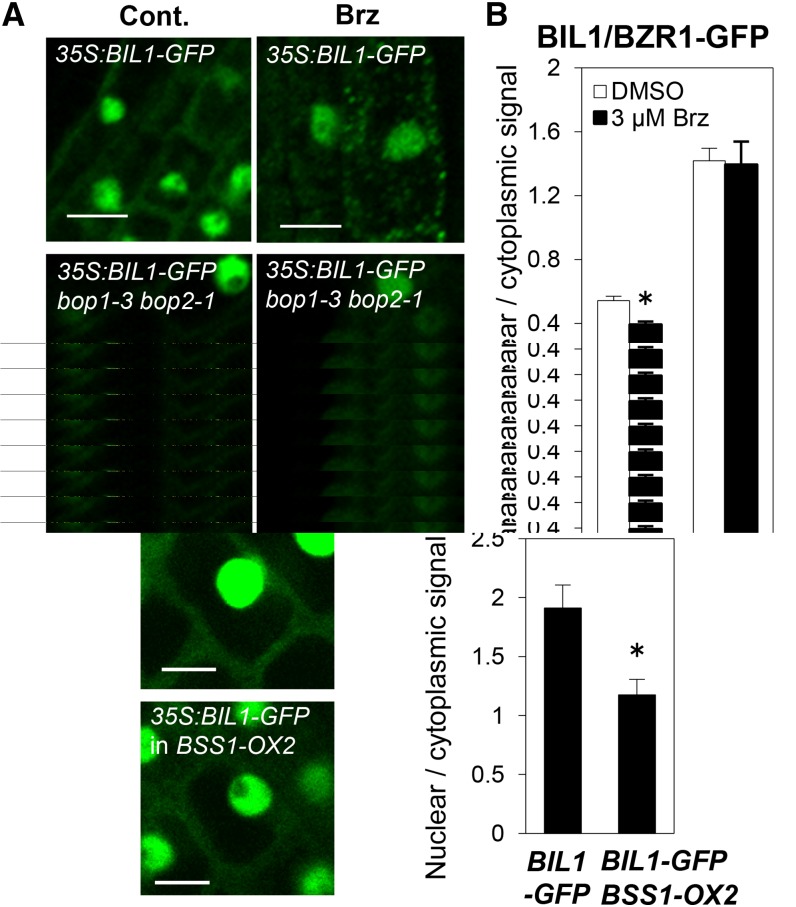
Figure 9.
BSS1/BOP1 Inhibited the Transport of BIL1/BZR1 from the Cytosol to Nuclei.
(A) Images of BIL1/BZR1-GFP in root cells of 4-d-old wild-type or bop1-3 bop2-1 seedlings grown on medium containing DMSO (Cont.) or 3 μM Brz (Brz). Bars = 10 μm.
(B) Graph showing the ratio of the nuclear-to-cytosolic signal intensity in root cells of 4-d-old seedlings. The results are presented as means ± se (n = 61). *P < 0.01, Student’s t test.
(C) Images of BIL1/BZR1-GFP in root cells of 4-d-old seedlings grown on medium in the wild-type or BSS1-OX2 background after treatment with 3 μM Brz for 3 h. Bars = 10 μm.
(D) Graph showing the ratio of the nuclear-to-cytoplasmic signal intensity. The results are presented as means ± sd (n = 27). *P < 0.01, Student’s t test.

