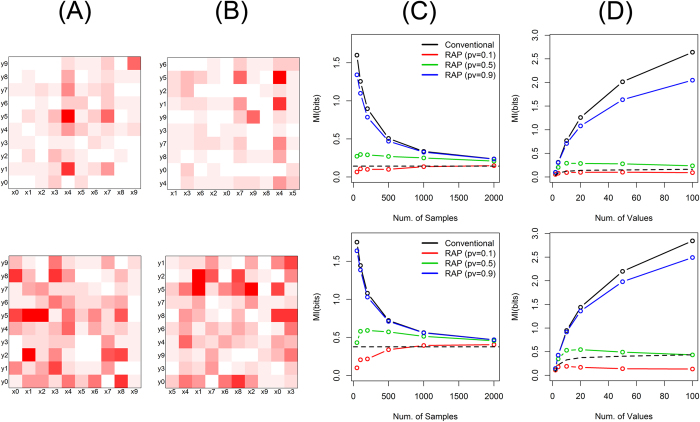
Figure 4. Mutual information of random structure.
The upper panels are for simulation setting (5) and the lower panels are for (6). (A) Each variable has 10 distinct categories, and their joint probability masses are randomly structured. (B) Observed data with randomly ordered categorical values. (C) Mutual information as the numbers of samples, by the conventional method (black) as well as by the proposed method (RAP: recursive adaptive partitioning) with different p-value thresholds (red: 0.1, green: 0.5, blue: 0.9). The true mutual information is shown with a dashed black line. (D) Mutual information as the numbers of distinct categories for each variable. 10, 50, 100, 250 and 500 samples were used for 2, 10, 20, 50 and 100 categories, respectively.

