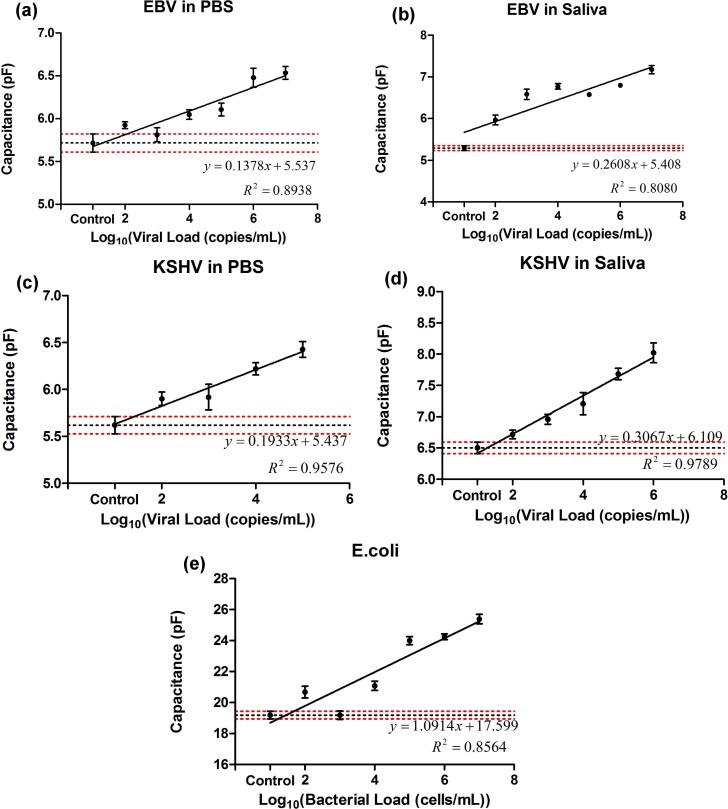
Figure 3. Microchip evaluation using EBV and KSHV spiked in PBS and saliva and E.coli spiked in saliva samples.
Linear correlations between viral load of samples and on-chip capacitance measurements at 2 V and 1 KHz for EBV-spiked PBS (a) and saliva (b) samples were calculated. The lowest dilutions with significant capacitance change as compared to virus-free control samples were 104 copies/mL in EBV-spiked PBS (a, p = 0.0070, n = 8) and 102 copies/mL in EBV-spiked saliva (b, p = 0.0007, n = 8) samples. Linear correlations between viral load of samples and on-chip capacitance measurements at 2 V and 1 KHz for KSHV-spiked PBS (c) and saliva (d) samples were calculated. The lowest dilutions with significant capacitance change as compared to virus-free control samples were 102 copies/mL (p = 0.0426, n = 8) and 103 copies/mL (p = 0.0047, n = 8) for KSHV-spiked PBS and saliva samples, respectively. Error bars represent standard error of mean. (e) E. coli was spiked in artificial saliva. 5% Triton was used in contrast to the 1% Triton used for viral lysis. The lowest statistically significant dilution of stock is 104 (p = 0.0013, n = 8) and was calculated utilizing Mann-Whitney analysis. Error bars represent SEM. Control samples were pathogen-free (a, c) PBS and (b, d, e) artificial saliva samples. Horizontal black and red dotted lines represent the average capacitance magnitude of the control samples and control ± standard error, respectively.

