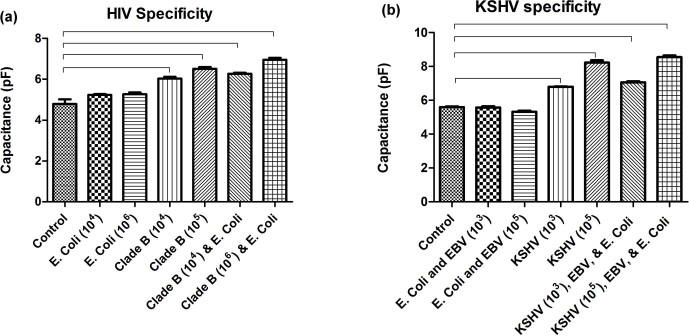
Figure 4. Specificity evaluations of the microchip.
(a) HIV-1 subtype B was specifically captured and detected in the presence of E. coli spiked in plasma samples. E. coli at concentrations of 104 cells/mL and 106 cells/mL showed no significant difference (p>0.05, n = 4) against HIV-free control. HIV-spiked samples (104 copies/mL and 105 copies/mL) and the mixture of HIV-1 and E. coli samples showed statistically different (p<0.05, n = 4) capacitance values compared to virus-free control samples. (b) KSHV was specifically captured and isolated from a mixture of KSHV, EBV and E. coli in artificial saliva. Mixtures of EBV (103 copies/mL and 105 copies/mL) and E. coli (103 cells/mL and 105 cells/mL) showed no significant difference (p>0.05, n = 4) in capacitance magnitude from KSHV-free control samples. KSHV-spiked samples at concentrations of 103 copies/mL and 105 copies/mL showed a significant difference (p<0.05, n = 4) from control. The capacitance magnitude of the mixture of KSHV, EBV, and E. coli samples were also significantly different than control samples. Brackets indicate statistically significant capacitance magnitude shift between the linked groups. Control samples were pathogen-free (a) plasma and (b) artificial saliva samples. Error bars represent standard error of mean (n = 4).

