
Figure 5. Device validation with patient samples.
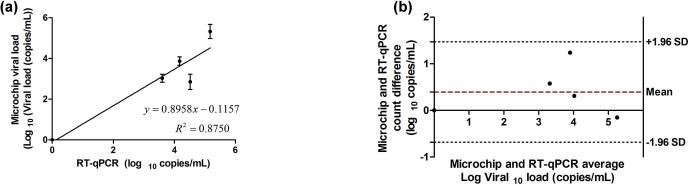
(a) Correlation data of microchip viral load and the viral load obtained through RT-qPCR. Viral load of zero was considered for patients with undetectable loads. Error bars represent standard error of mean (n = 8). (b) Bland-Altman comparison of viral loads obtained through RT-qPCR and our printed flexible plastic microchip. Bland-Altman analysis did not show any evidence of systematic bias. Quantitative information is available in supplementary Table S2.