Figure 4.

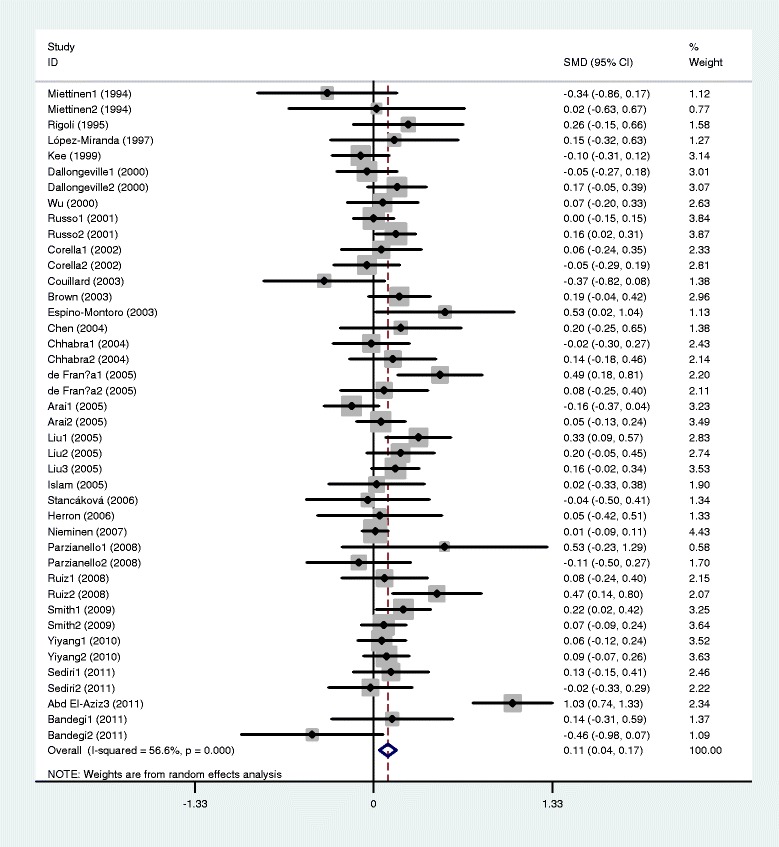
Forest plot of the APOC3 rs5128 polymorphism and plasma levels of LDL-C association. Result from the analysis on all 42 comparisons.

Forest plot of the APOC3 rs5128 polymorphism and plasma levels of LDL-C association. Result from the analysis on all 42 comparisons.