Fig. 1.
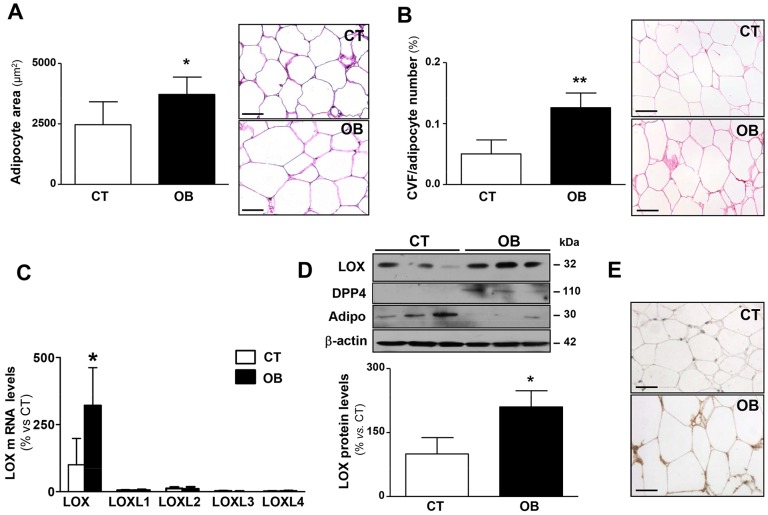
Adipocyte size, total collagen content and lysyl oxidase expression in visceral adipose tissue from control subjects and morbidly obese individuals. (A) Quantification of adipocyte area (left) and representative microphotographs of visceral adipose tissue sections from control subjects (CT) and morbidly obese individuals (OB) stained with haematoxylin and eosin and then examined by using light microscopy (magnification 40×; right). (B) Quantification of collagen volume fraction (CVF) normalised for adipocyte number. Right panel shows representative microphotographs of visceral adipose tissue sections from these individuals stained with Picrosirius red that were then examined by using light microscopy (magnification 40×). (C) mRNA levels of lysyl oxidase (LOX) and LOX-like (LOXL) isoenzymes 1, 2, 3 and 4 evaluated using real-time PCR of these samples. Results were normalised to the expression of 18S RNA. (D) LOX, DPP4 and adiponectin (Adipo) protein levels determined by western blotting. β-actin was analysed as loading control. (E) Representative images of the immunohistochemical analysis for LOX are presented (magnification 40×). Histograms represent the mean±s.d. of five subjects. Scale bars: 50 µm. *P<0.05 and **P<0.01 vs control group.

