
Figure 1.
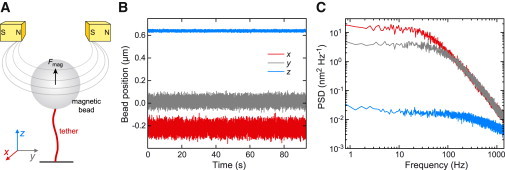
(A) Scheme of the experimental setup. (B) Time trajectories for the x, y, and z positions of a magnetic bead with a nominal radius of ∼520 nm attached to a 1.9-kbp-long DNA molecule held at a force of 4.9 ± 0.1 pN. The position signals were recorded at 2800 Hz. (C) Power spectral densities (PSDs) for the time trajectories shown in (B). The spectra shown were obtained by averaging 40 individual PSDs.