
Figure 3.
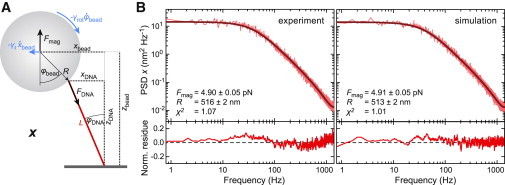
Fitting the PSD spectra for the lateral bead fluctuations perpendicular to the magnetic field lines considering two coupled oscillators. (A) More realistic scheme of the bead-DNA system where the angular displacement of bead and DNA are allowed to differ from each other. (B) PSDs (light red) of the experimentally determined and the simulated position trajectory from Fig. 2 and fits (dark red) to the data that are based on a double Lorentzian according to Eq. S13. The fit residues normalized by the PSD at the given frequency are shown below the PSD spectra. Values provided in the graphs were obtained from the fits. The simulation was carried out using a force of 4.92 pN and a bead radius of 515 nm.