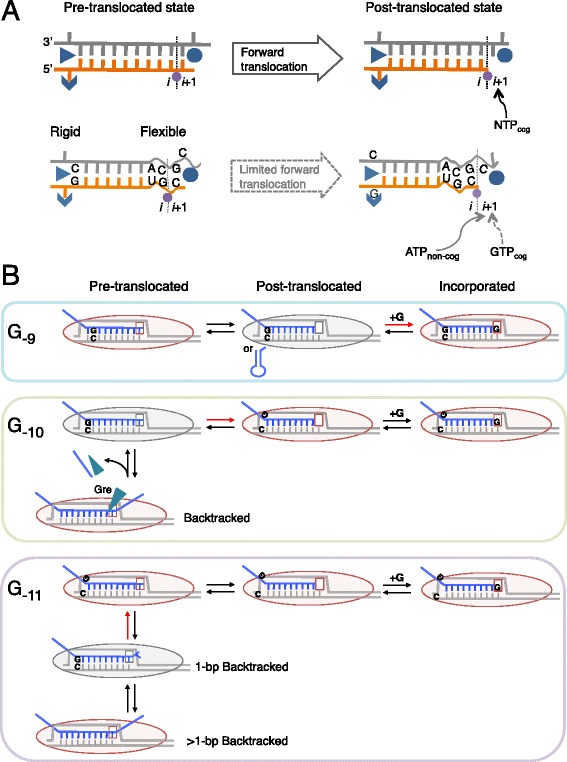
Fig. 8.

Structural and kinetic models of transcription pausing in vivo. (a) Structural model. RNAP elongation in a pause-free sequence (top) or the PIE (bottom) is shown. RNA (orange), template DNA strand (gray), catalytic Mg2+ (magenta), and two RNAP domains (blue) involved in the 5′ RNA separation from the RNA-DNA hybrid, i.e., Switch 3 (arrow head), lid (triangle) domain, and the bridge helix of RNAP (blue circle) are shown. The 3′ RNA-binding site (i) and the NTP binding site (i + 1) are also indicated. The 3′ ACGC 5′ sequence in the template DNA and the complementary 5′ UGC 3′ RNA sequence increase the flexibility of their backbones, which decreases cognate GTP (GTP cog) addition and increases non-cognate ATP (ATP non-cog) addition to the 3′ RNA end. The two RNAP domains can interact with riboG-dC at the upstream end of the hybrid, which interferes with the hybrid movement through the catalytic cleft of RNAP. (b) Kinetic model. RNAP pauses in the post-translocated (G−9 or RNA hairpin, top), pre-translocated (G−10, middle), and backtracked states (G−11, bottom). RNAPs with the i + 1 NTP binding site are shown (oval shapes with empty squares). Gre factors are indicated by cyan triangles. Post- and pre-translocated pauses were mainly observed in WT cells, and backtracked pauses were observed in ΔgreAB cells. The rate-determining steps during elongation are indicated by red arrows. The RNAP conformations captured by RNET-seq are indicated by gray ovals. Note that the GreAB-dependent cleavage, which occurs between i and i + 1 sites, ultimately converts the backtracked state to the post-translocated state. This state is rapidly converted back to the pre-translocated state prior to the next NTP binding and bond formation at the i + 1 site. The presence of activation energy much higher than k B T in each rate-determining step is assumed for the kinetic description of pausing in vivo [1, 39]
