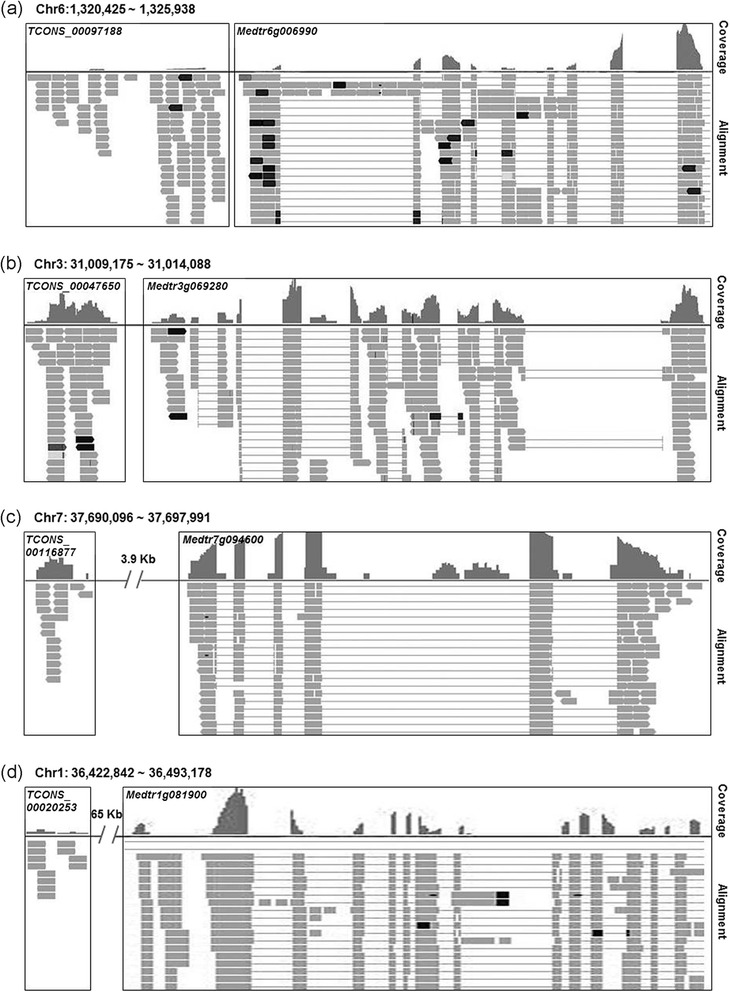
Fig. 6.

Structure of lncRNAs and their putative targets. Each figure has two separate panels showing the read coverage and alignment of RNA-Seq data. In the panel of read coverage, the height represents the expression level of corresponding loci in the genome; in alignment of RNA-Seq panel, the rectangles represent the regions which can be transcribed
