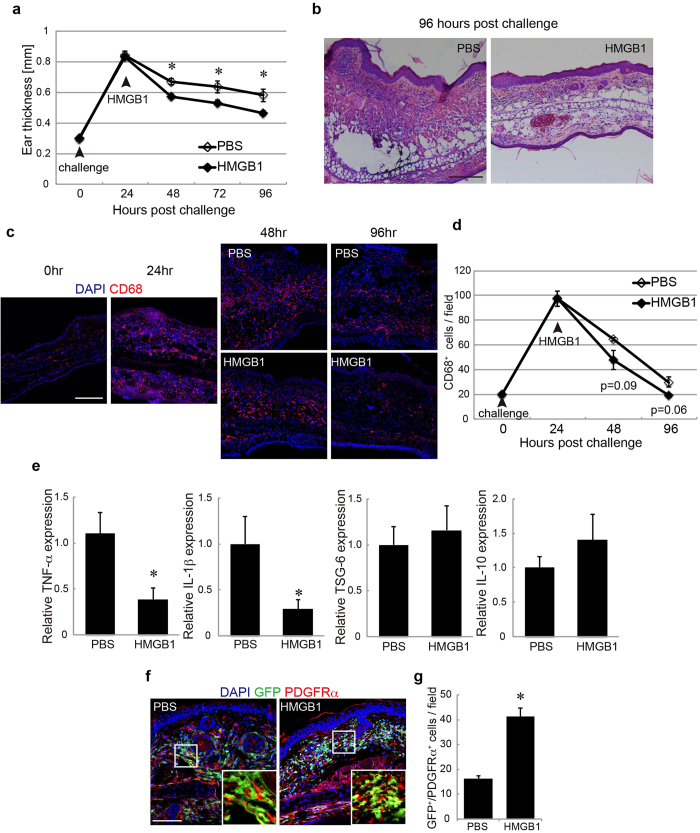
Figure 5. HMGB1 induced changes in the ear skin of ACD model mice.
a: Ear thickness changes following PBS (white) or HMGB1 (black) administration. b: H&E staining of ear skin. Bar = 100 μm. c: Ear skin regions stained with CD68 in GFP-BMT mice at each time point after the challenge. d: The number of CD68+ cells per field was quantified at each time point. e: The expressions of TNF-α, IL-1β, TSG-6, and IL-10 in ear skin. f: Ear skin regions stained for PDGFRα in GFP-BMT mice at 96 h after the challenge. g: The number of GFP+/PDGFRα+ cells per field was quantified. h: Ear skin regions stained for SDF-1α in the GFP-BMT mice at 96 h after the challenge. Nuclei were stained with DAPI. Bar = 100 μm. *P < 0.05.

