
Figure 2. Average 3D Flight speed.
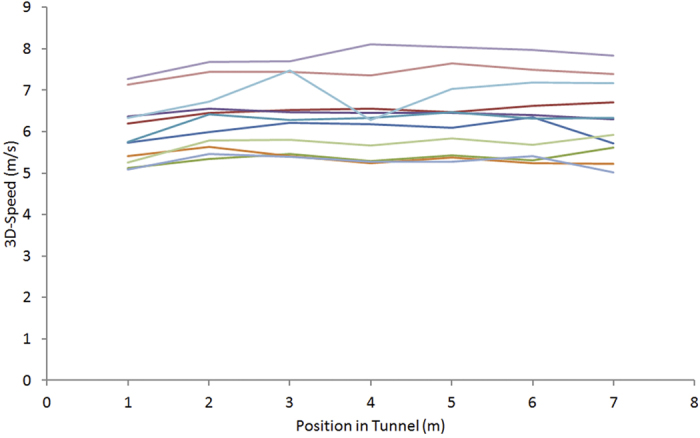
Flight speed along the tunnel’s longitudinal axis, shown for each of the 11 birds averaged over all control trials, during which the gratings were stationary.
Official websites use .gov
A
.gov website belongs to an official
government organization in the United States.
Secure .gov websites use HTTPS
A lock (
) or https:// means you've safely
connected to the .gov website. Share sensitive
information only on official, secure websites.
Flight speed along the tunnel’s longitudinal axis, shown for each of the 11 birds averaged over all control trials, during which the gratings were stationary.