
Figure 1. Phase diagram of the three-strategy spatial inspection game with uniform punishment.
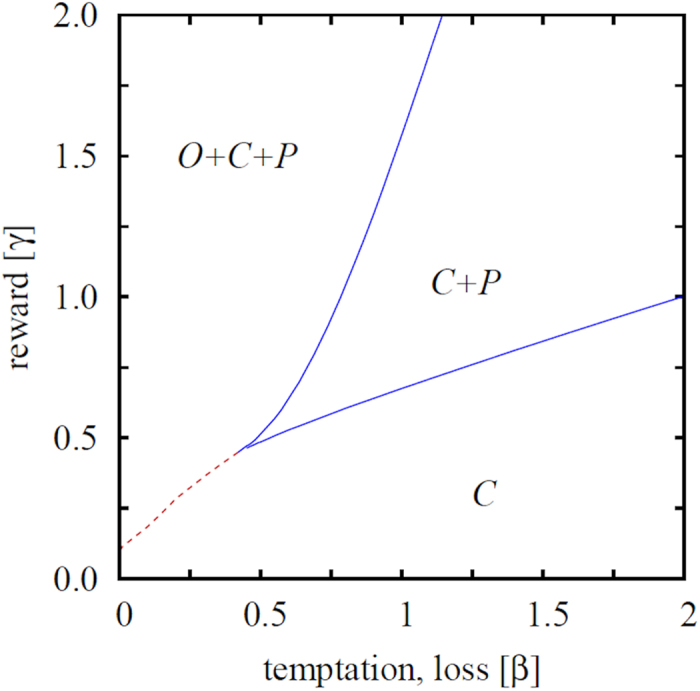
Depicted are strategies remaining on the square lattice after sufficiently long relaxation times as a function of the temptation/loss β and the reward for punishing criminals γ, as obtained for the the punishment cost α = 0.5. Here C marks the parameter region where the population terminates in a homogeneous “all-criminal” phase, C + P marks the region where criminals and punishers coexist, while in the O + C + P region all three strategies are present in the stationary state due to cyclic dominance. Solid blue lines denote continuous phase transitions, while the dashed red line denotes the border of cyclic dominance between competing strategies.