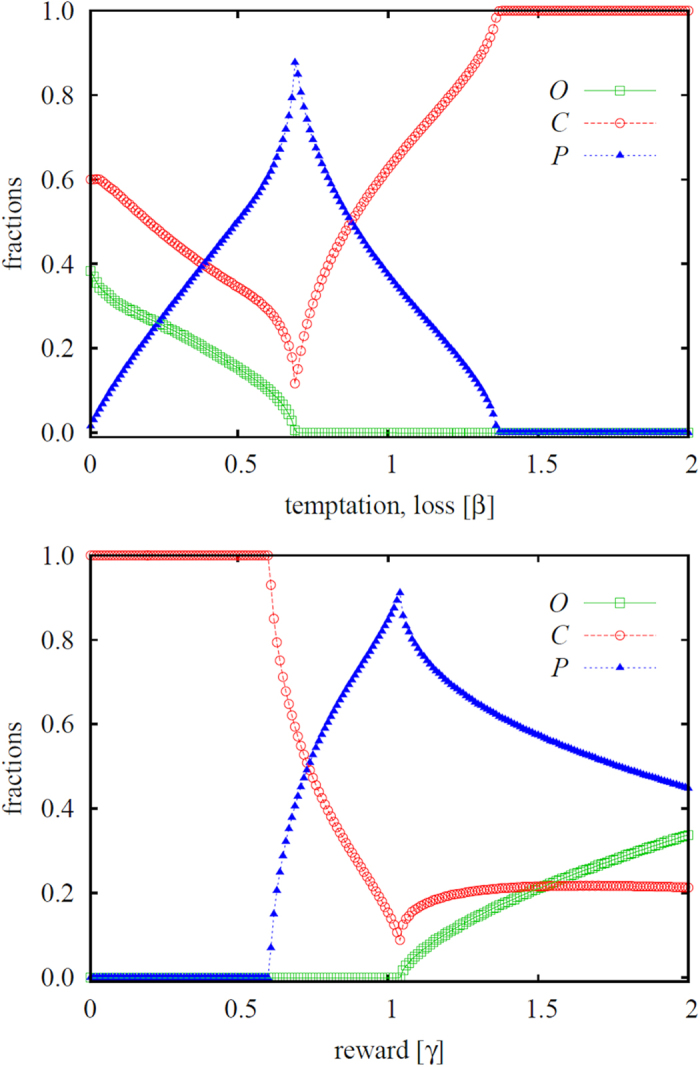
Figure 2. Two characteristic cross-sections of the phase diagram depicted in Fig. 1.

Left panel shows the fraction of the three strategies in dependence on the temptation/loss β at γ = 0.8. Starting at the three-strategy O + C + P phase, the fraction of ordinary people and the criminals decreases steadily with increasing the value of β until eventually O die out and the two-strategy C + P phase is reached. Immediately thereafter the fraction of criminals starts rising as the value of β increases further, with the second continuous phase transition marking the emergence of the pure C phase. Right panel shows the fraction of the three strategies in dependence on the reward for punishing criminals γ at β = 0.8. In this case we start at the pure C phase, which turns to the two-strategy C + P phase as soon as γ is large enough to sustain the punishers. As γ increases further ordinary people become viable too through a second continuous phase transition, ultimately yielding the three-strategy O + C + P phase that is maintained by cyclic dominance. In both panels the punishment cost is α = 0.5.
