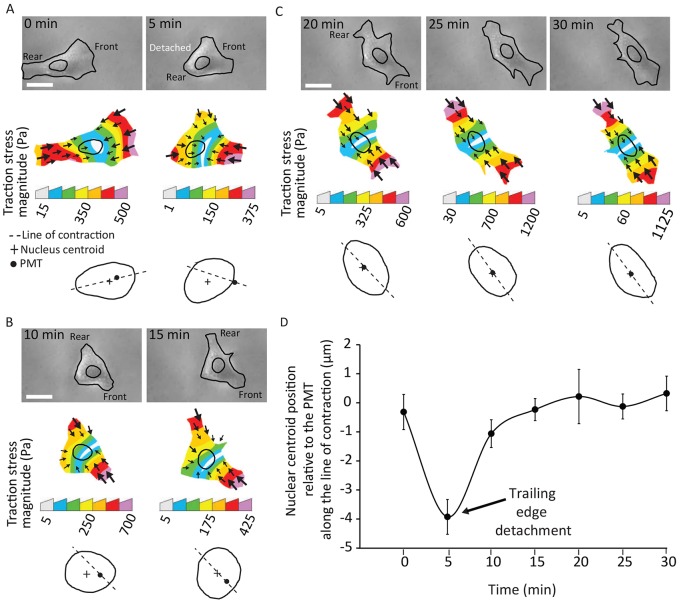
Fig. 2.
The nucleus is dynamically moved in the direction of the PMT. (A) DIC images of a representative cell during different phases of migration (top), the corresponding traction-stress maps (middle) and corresponding nuclear outlines showing the relative positions of the PMT and nuclear centroid (bottom). Following spontaneous tail detachment, the PMT moves towards the leading edge and the nucleus lags behind it. (B) The nucleus does not respond quickly and lags behind the PMT for a few minutes. (C) The nucleus dynamically re-coincides with the PMT as the cell shape is re-established. Scale bars: 20 µm. (D) Time-dependent profile of the position of the nuclear centroid relative to the PMT along the line of contraction. The nuclear centroid lags behind the PMT just after the detachment of the trailing edge (t=5 minutes) and then is moved to coincide with it over time. Error bars represent s.e.m. N=10 cells.

