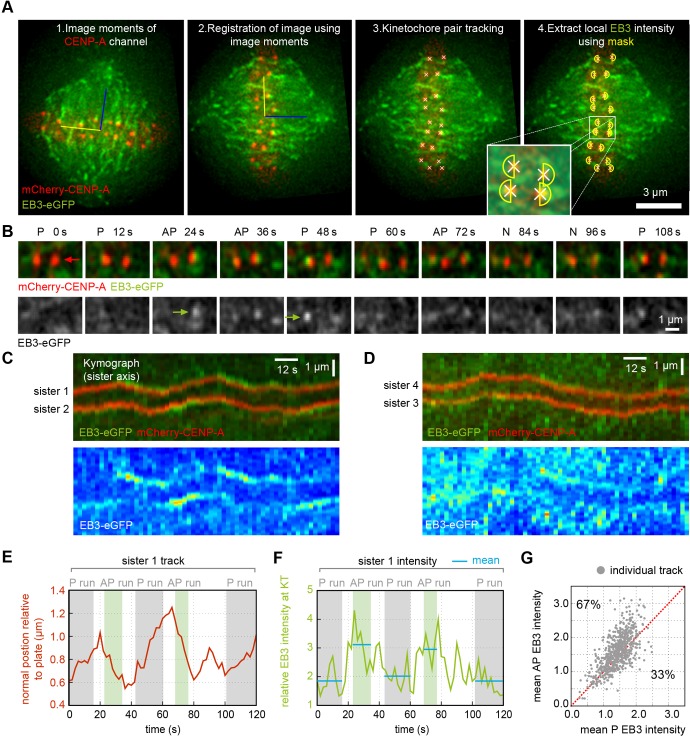
Fig. 1.
EB3 preference for anti-poleward-moving kinetochores. (A) 2D tracking of kinetochore positions (labelled with mCherry–CENP-A; red). 1: Image moments from the mCherry channel and centre of mass given by both channels define an (x,y) reference frame (blue and yellow lines). 2: Frames were registered using this coordinate system. The blue line is the spindle axis, yellow line is in the metaphase plate. 3: Kinetochore spots were located and tracked as described previously (Jaqaman et al., 2010). 4: Semi-circular masks (yellow) were centred on kinetochores orientated along the spindle axis allowing measurement of kinetochore-proximal EB3–eGFP intensity (green). (B) Individual frames from a typical mCherry–CENP-A EB3–eGFP movie in merged (top) and greyscale EB3–eGFP (bottom). The movement state of one kinetochore (red arrows) as poleward (P) or anti-poleward (AP) is given on top of each frame. N indicates directionless. EB3 labelling of the anti-poleward kinetochore is indicated by green arrows on greyscale image. (C,D) Kymographs of sister kinetochore pairs showing merged mCherry–CENP-A and EB3–eGFP (top) and false-colour EB3–eGFP (bottom). The kymograph profile is aligned along the sister–sister axis and is maintained at a fixed distance to the metaphase plate. This allows the visualisation of oscillations (see Materials and Methods), as opposed to kymographs that centre on the pair of kinetochores. (E) Kinetochore position relative to the metaphase plate versus time plot of sister 1 highlighted in C with anti-poleward (AP) runs shaded light green and poleward (P) runs shaded grey. Note that algorithm is conservative to avoid including directional switches where direction is uncertain. (F) Maximum EB3–eGFP intensity measured within the kinetochore mask (yellow semicircle in A) for sister 1 shown in C. Blue horizontal lines indicate means of each run. (G) Mean EB3–eGFP intensity of anti-poleward (AP) runs and poleward (P) runs within each track (n=850). Grey dots represent individual tracks. The red line indicates the mean EB3–eGFP intensity of anti-poleward runs being equal to mean EB3–eGFP intensity of poleward runs; the percentage of tracks above and below this line are indicated.

