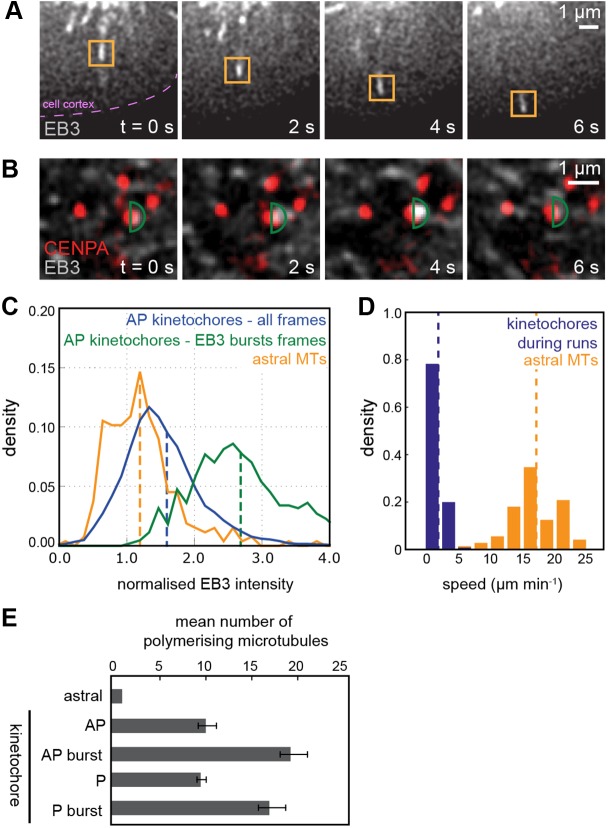
Fig. 3.
Assessing degree of polymerisation in K-fibre by comparison to astral MTs. (A) Growth of astral MT labelled with EB3–eGFP at the tip. The orange box indicates the mask used to measure maximum intensity of astral MT. Note that given that the MT is locally the brightest feature the size and shape of the mask is not important provided it encloses only the MT tip of interest. (B) Oscillating kinetochore pair labelled with mCherry–CENP-A (red) shown in overlay with EB3–eGFP (greyscale). The anti-poleward moving kinetochore (right sister of pair) experiences a burst in EB3–eGFP localisation at 4 s. Green semi-circle indicates fluorescent intensity measurement mask (radius 0.3 µm). The maximum pixel intensity within this mask is recorded. (C) Histogram showing intensity distribution of EB3–eGFP within the kinetochore mask (maximum pixel intensity within the mask is used), for all frames of anti-poleward kinetochores (blue) and during anti-poleward bursts (green; see B). The maximum mask intensity distribution of astral MT EB3 comets is shown in orange (see A). The average normalised EB3 intensities (indicated by dashed line) for astral MTs, anti-poleward kinetochores (all frames) and EB3 burst frames are 1.2, 1.6 and 2.7, respectively. (D) Kinetochore speeds (blue) during runs and astral MT speeds (orange) for growing astral MTs. The average speeds (indicated by dashed line) are 1.8 µm min−1 and 17 µm min−1 respectively (n=850 and 73, respectively). (E) Estimated mean number of polymerising MTs in anti-poleward (AP) and poleward (P) KTs and during anti-poleward (AP burst) and poleward bursts (P burst), compared to a single astral MT (see supplementary material Table S3 for details). Results represent mean±s.d. anti-poleward (AP, n=7134), anti-poleward with burst (AP burst, n=456), poleward (P, n=7058), poleward with burst (P burst, n=160).

