Fig. 4.
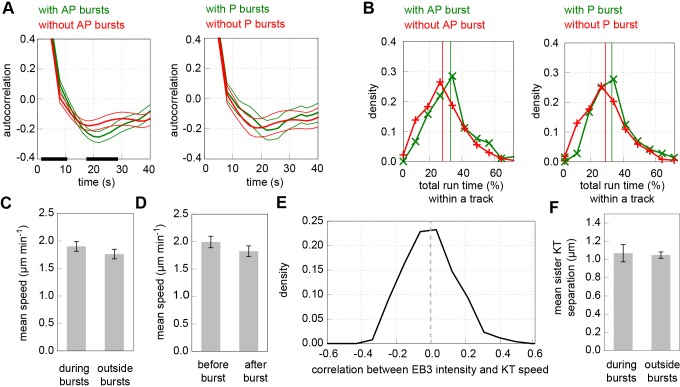
Effects of bursts on kinetochore dynamics. (A) Autocorrelation of kinetochore centre position displacement in direction normal to metaphase plate in tracks with (green, n=197) and without (red, n=653) anti-poleward (AP) bursts (left panel) and similarly for poleward (P) bursts (right panel; green, n=66; red, n=784). Shown are mean±s.e.m. autocorrelations. The black lines along the horizontal axis represent significant difference at the 1% level. (B) Total length of time spent in directed runs for each track as a percentage of track length, in tracks with (green, n=197) and without (red, n=653) an EB3 burst, in anti-poleward (left) and poleward bursting tracks (right; green, n=66; red, n=784). Vertical lines indicate means. (C) Mean kinetochore speed in a window of five frames around a burst (left; n=279) and mean from each run excluding the burst window (right; n=279). Error bars indicate s.e.m. (D) Mean kinetochore speed in 3 frames before the burst (left) and 3 frames after burst (right), not including the burst frame itself (n=319). Error bars indicate s.e.m. (E) Distribution of correlation between EB3–eGFP intensity and kinetochore speed (n=850). Dashed line indicates mean. (F) Mean separation between sister kinetochores in a window of five frames around a burst (left; n=112) and mean from each run excluding the burst window (right; n=112). Error bars indicate s.e.m.

