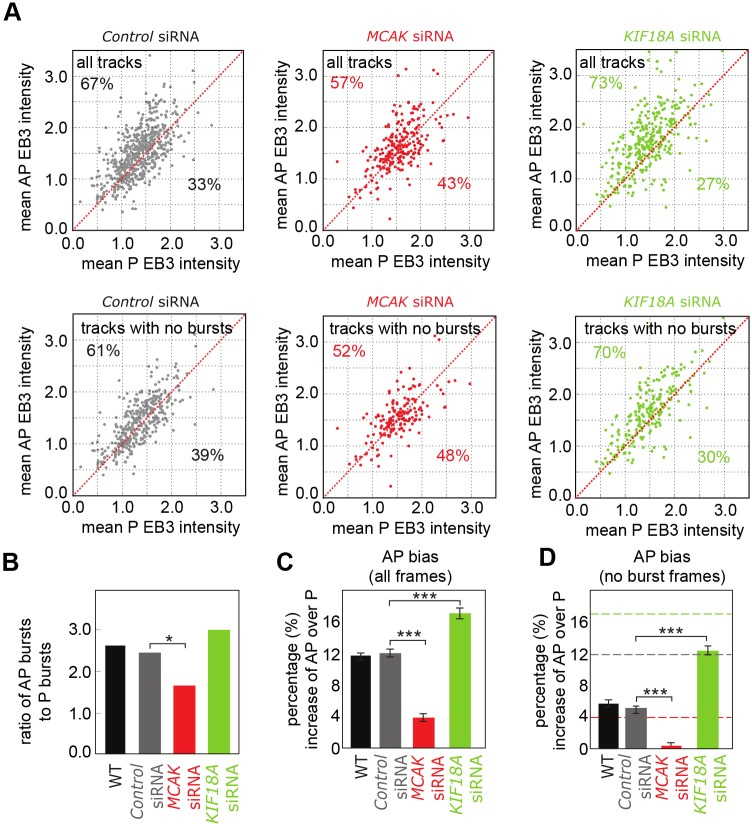
Fig. 6.
Depletion of MCAK and KIF18A inhibits and enhances EB3 anti-poleward bias, respectively. (A) Top, mean EB3–eGFP intensity of anti-poleward (AP) runs and poleward (P) runs within each track in control (left), MCAK (middle) and KIF18A (right) siRNA-treated cells (n=850, 350, and 469, respectively). Bottom, mean EB3–eGFP intensity of anti-poleward runs and poleward runs within tracks with no bursts in control (left), MCAK (middle) and KIF18A (right) siRNA cells (n=583, 262, and 352, respectively). The red line indicates the mean EB3–eGFP intensity of anti-poleward runs being equal to mean EB3–eGFP intensity of poleward runs; the percentage of tracks above and below this line are indicated. (B) Ratio of anti-poleward burst count to poleward burst count. WT, wild-type. (C) Bias of EB3 for anti-poleward kinetochore as a percentage increase over poleward kinetochore intensity (average across all frames). Results are the mean±s.e.m., see supplementary Table S2 rows 2, 29 and 36 for n. (D) Bias of EB3 for anti-poleward kinetochore as a percentage increase over poleward kinetochore intensity in tracks with bursts frames excluded. Results are the mean±s.e.m., see supplementary Table S2 rows 8, 30 and 37 for n. Dashed lines indicate the bias of frames in all tracks for comparison for control (grey), MCAK siRNA (red), KIF18A siRNA (green) from (C). *P<0.05; ***P<0.001.

