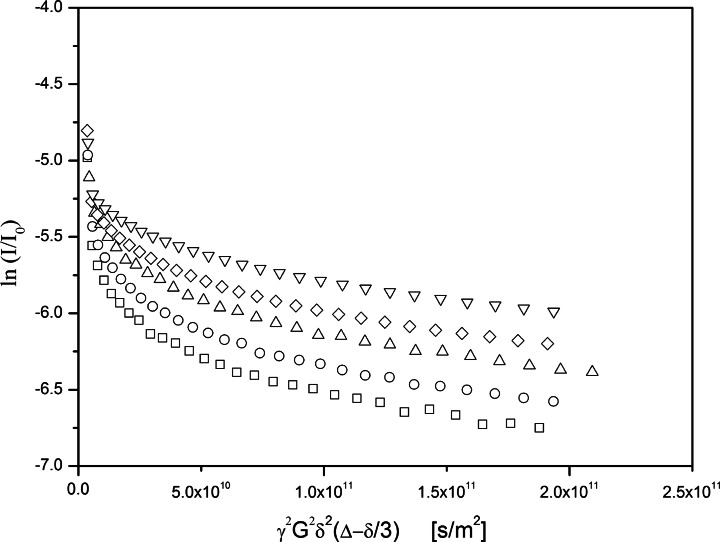
Fig. 4.
Stejskal-Tanner-plots resulting from a PFG-NMR experiment on the dispersion obtained in the pressure cell experiment. The initial drop of the relative echo intensities between 0 < ln((I/I0) < −5.25 is only partially shown. The five plots refer to time intervals of ∆ = 15 ms (squares), 25 ms (circles), 50 ms (triangles), 100 ms (diamonds), and 200 ms (inverted triangles) respectively

