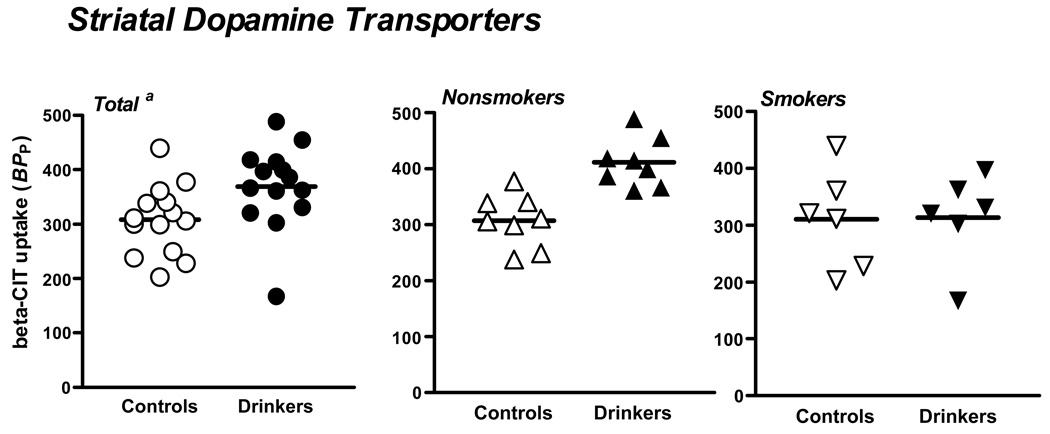
Figure 1.
Striatal [123I]β-CIT binding in controls and alcohol drinkers in the total group and by smoking status. a. The bar represents the mean in each group. Percent difference was calculated as [(alcohol drinker – control)/alcohol drinker x 100]. In the total group, there was a 16% difference (P=0.04), in the nonsmokers a 26% difference (P=0.006), and in the smokers a 1% difference (P=1.0).

