
Figure 4.
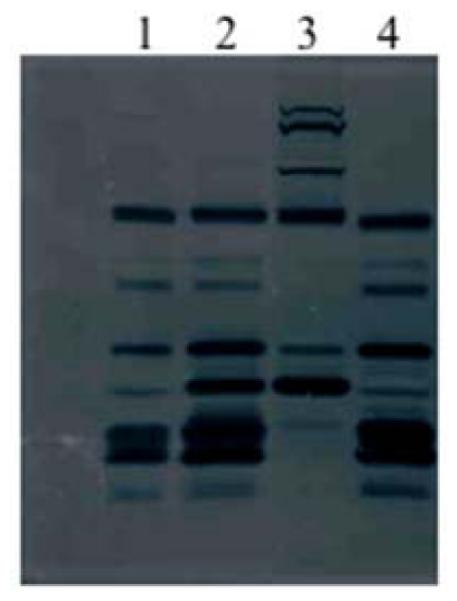
Zymogram analysis of the Pspac-regulated walR and walK mutants. Equal amounts (10μg) of proteins prepared from the supernatants of the Pspac-regulated walR and walK mutants were loaded and separated on 10% SDS-PAGE containing S. aureus RN4220 cells (0.2% wet weight of heat-killed cells). Following electrophoresis, gels were soaked in water for 30 min at room temperature under gentle agitation, then transferred to a renaturing buffer (25mM Tris-HCl, pH 7.0 containing 1% Triton X-100) and incubate at 37°C with gentle agitation for 1-4 h. Lytic bands appeared as clear zones on an opaque background, but showed dark zones after scanning. Lane 1, RNPspac-WalK without IPTG; Lane 2, RNPspac-WalK with IPTG; Lane 3, RNPspac-WalR without IPTG; Lane 4, RNPspac-WalR with IPTG.