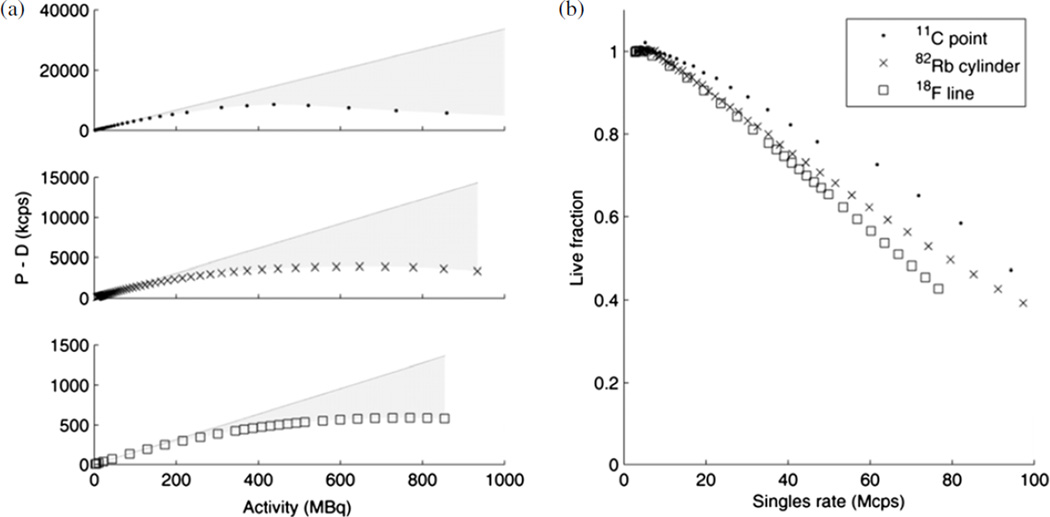
Figure 5.
(a) Randoms-corrected (prompts–delays) coincidence rates for 18F, 82Rb and 11C phantoms. A line is extrapolated from the low-activity data points of each phantom, and the shaded area between the line and the measured data is an approximation of the lost counts. (b) Live fraction is the fraction of events that are detected, i.e. the ratio of the data to the extrapolated line.

