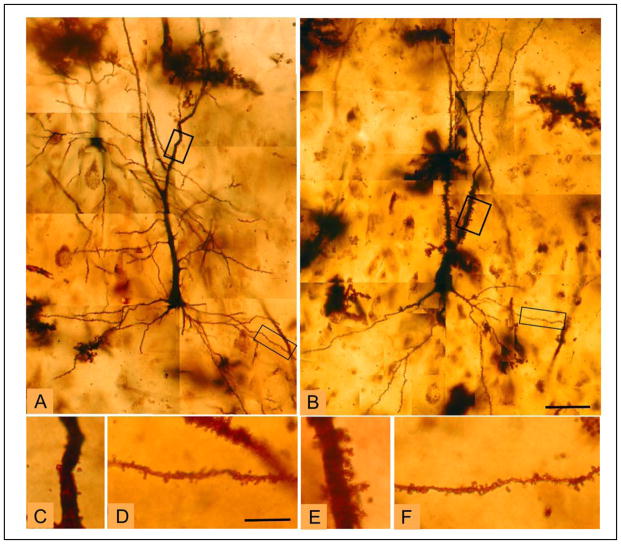
Figure 3.
Photomicrographs illustrating CA3 pyramidal neuron morphology.
Montages of representative CA3 pyramidal neurons from a (A) healthy control case and (B) a case with schizophrenia further illustrate the increased spine density on the apical dendrite in schizophrenia. Boxes indicate enlarged sections of apical and basal dendrites, shown below from a healthy control (C, control, apical dendrite; D, control, basal dendrite) and a schizophrenia case (E, schizophrenia, apical dendrite; F, schizophrenia, basal dendrite), respectively. Scale bars for A, B = 50 μm; scale bars for C–F = 10 μm.

