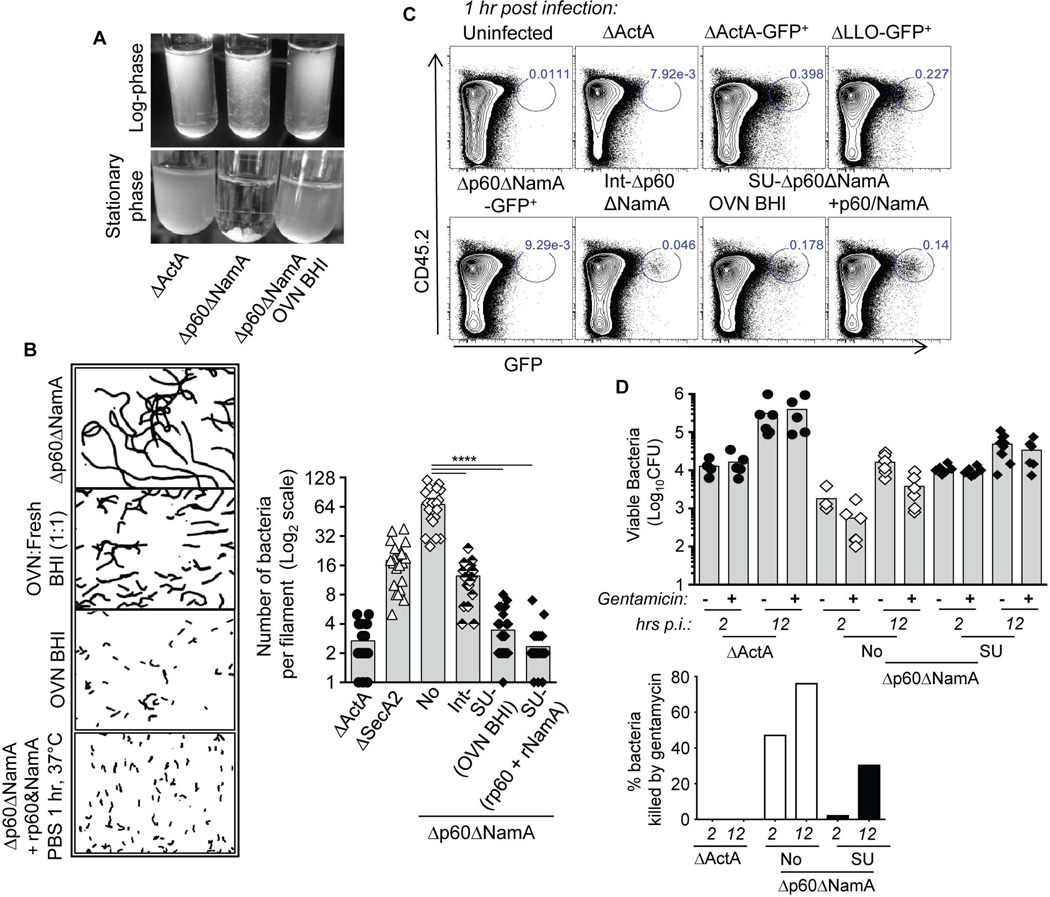
Figure 3. Filamentation prevents cell invasion and efficient host spleen colonization.
(A) Pictures of log or stationary phase cultures of indicated Lm mutants grown in fresh BHI or in filtered BHI from OVN grown ΔLLO Lm containing secreted p60 and NamA. (B) Gram staining of log-phase Δp60ΔNamA Lm grown in indicated conditions. (C) WT B6 mice were inoculated with 0.6–1×10⁸ of indicated GFP+ Lm mutants and 1 hr later spleens were harvested, cells stained with cell-surface CD45.2 and analyzed by FACS to determine the frequencies of GFP+ cells (blue numbers) amongst live spleen cells, e.g., cells that contain viable Lm. In (D), mice received gentamycin 1 hr post immunization and spleens were harvested and plated at indicated times to determine Lm titers (upper graph). The lower graph represents the same data as a relative proportion (%) of Lm killed by gentamicin, e.g., extracellular bacteria. All experiments show representative data of 1 of 2 independent replicate experiments; in (D) the pool of the 2 experiments is shown with each symbol representing 1 mouse. Histogram bars average mean values (B, D).

