
Fig. 3.
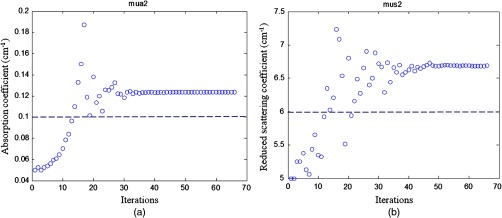
Simulation results of the fitted second layer optical properties versus iterations. (a) Fitted second layer absorption coefficient versus iterations and (b) fitted reduced scattering coefficient versus iterations. The dashed lines are the calibrated values. The first layer optical properties of and were used as the initial values. The layer thickness was 1.5 cm. The fitted second layer properties were and .