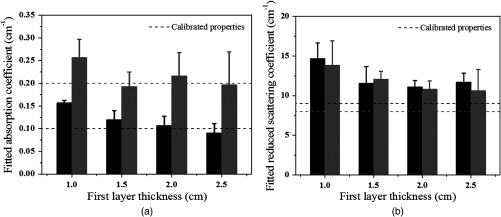
Fig. 7.

Fitted second layer properties versus different thickness of the first layer obtained from all sets of phantom experiments. (a) Fitted absorption coefficients and (b) fitted reduced scattering coefficients as functions of first layer thickness of 1.0, 1.5, 2.0, and 2.5 cm. Black bars were fitted optical properties corresponding to the first set of second layer properties given in Table 2, and gray bars represent fitted optical properties corresponding to the second set of second layer properties given in the same table. The dashed lines are the calibrated values.
