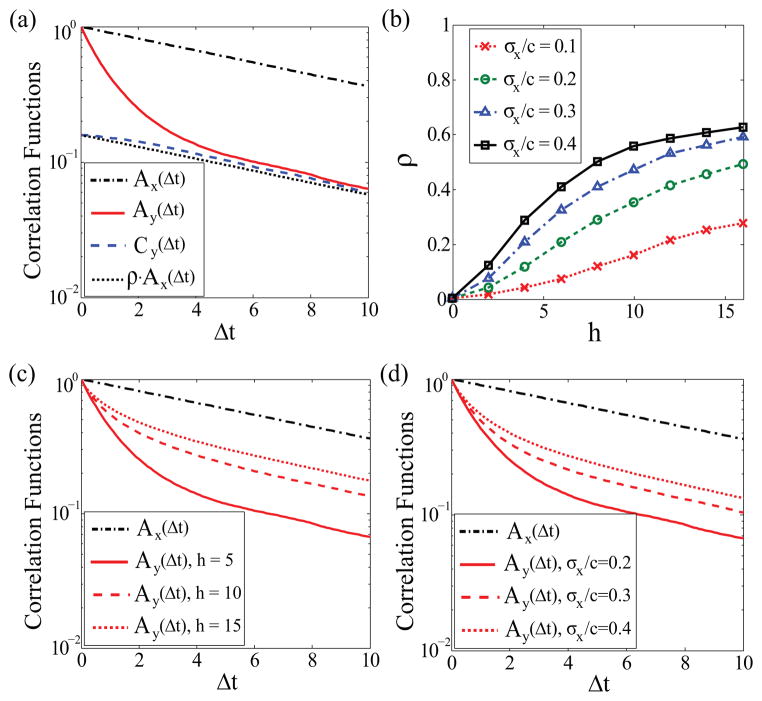
FIG. 2.
(Color online) (a) The correlation functions
 ,
,
 , and
, and
 versus the time lag Δt. Parameters used in this simulation: h = 5, c = Kd, σx/c = 0.2, τy = 1, and τx = 10. (b) The correlation coefficient ρ versus the Hill coefficient h for different levels of input noise σx/c. (c)
 <
<
 , regardless of h. (d)
 <
<
 , regardless of σx/c.

