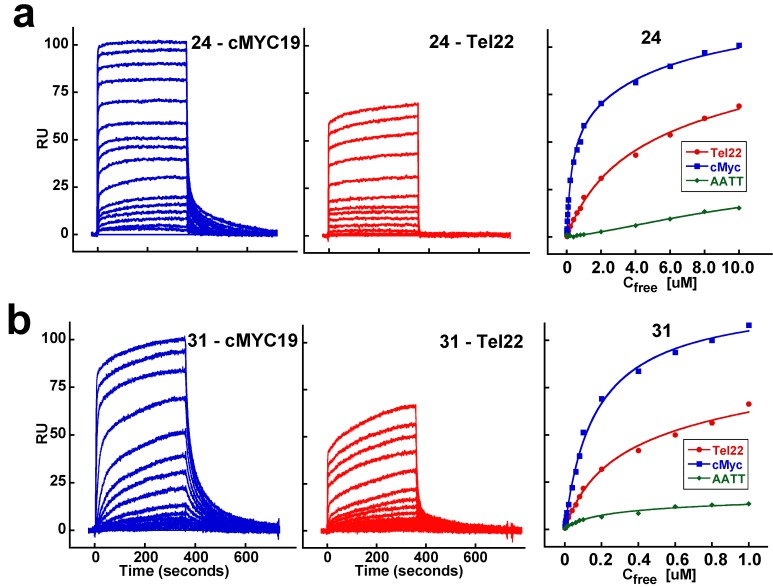
Figure 2.
SPR sensorgrams and the steady-state binding plots for the parent cyanine (24, panel a) and the brominated analog (31, panel b) with Tel22 and cMYC19 quadruplexes and a control duplex (AATT). The injected concentration range for 24 is 10 nM–10 µM and for 31 is 10 nM–1 µM. The binding plots were obtained by fitting the steady-state response values (RU) as a function of free ligand concentration (Cfree) and fit to a two-site binding model. The estimated equilibrium binding affinities (K1 and K2) are reported in Table 2.

