
Figure 2.
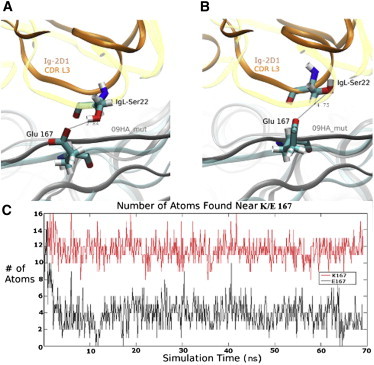
Loop motions near Glu 167 in 09HA_mut. (A) The position of Glu (E) 167 relative to the CDR L3 loop (yellow), at the beginning of the simulation. (B) After the end of the simulation, the loops moved away from the HA and the CDR L3 (orange) was further away from the Glu167. (C) The number of Ig-2D1 atoms (y axis) within 4.6 Å of K167 (09HA, red) and E167 (09HA_mut, black) over time (x axis). To see this figure in color, go online.