
Figure 3.
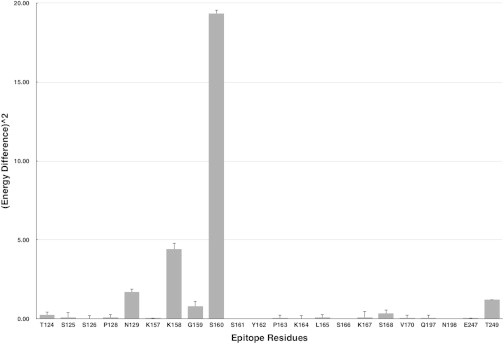
The free energy differences squared are shown for all epitope residues between 18HA and 09HA. Y axis is the energy difference squared, ΔΔG2=(ΔG18HA−ΔG09HA)2, and x axis are the residue name and residue ID from 18HA. The two mutations are S160N and V170I from 18HA to 09HA. Detailed data may be found in Tables 3 and S8.