
Figure 5.
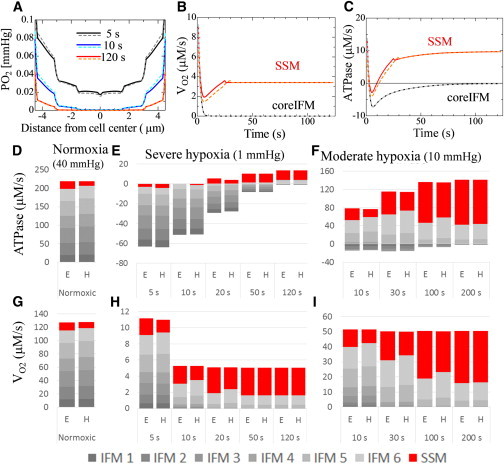
Response to step decreases in extracellular PO2 from 40 to 1 mmHg (severe hypoxia) or 10 mmHg (moderate hypoxia). (A–C) Upper panels compare responses to severe hypoxia between the equal (solid line) and hetero (dotted line) models: (A) radial distribution of oxygen at 5, 10, and 120 s after onset; (B) oxygen consumption; and (C) mitochondrial ATPase activity. (D–I) Lower panels show the contributions of IFM and SSM to ATP production (D–F) and oxygen consumption (G–I) under normoxic (D and G), severely hypoxic (E and H), and moderately hypoxic (F and I) conditions. In graphs D–I, cumulative bar charts are used to show changes in the total amount and contribution of each subpopulation. E, equal model; H, hetero model. IFMs are numbered by their locations from the core to the cell surface. To see this figure in color, go online.