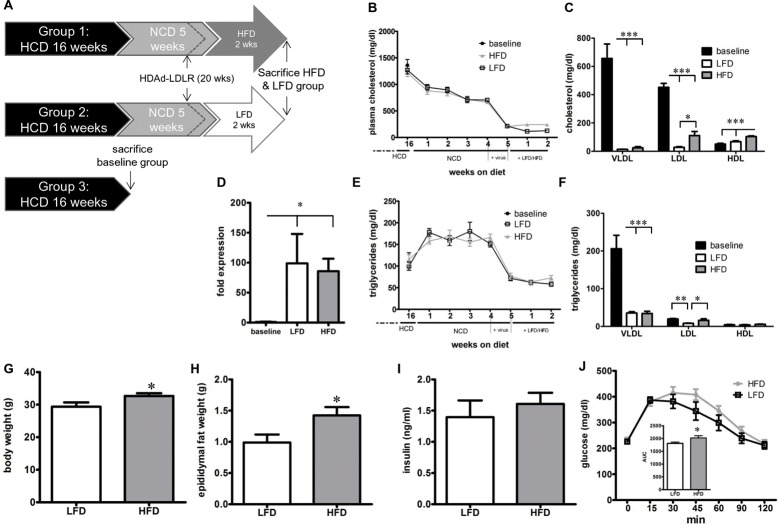
Fig 1. Lipid profile and metabolic phenotype in HFD vs. LFD-fed mice with HDAd-LDLR retreatment.
(A) Schematic diagram showing the experimental course. Following 16 weeks of HCD, baseline mice were sacrificed. The remaining mice were put on a diet with no added cholesterol (NCD) and treated with the HDAd-LDLR at week 21. At week 22 mice were divided into a HFD and LFD group and sacrificed after 2 weeks. (B) Total plasma cholesterol and (C) cholesterol subfractions of baseline, LFD and HFD-fed mice. (D) Hepatic LDLR mRNA expression before and after (HFD & LFD) HDAd-LDLR treatment. (E) Total plasma triglycerides and (F) triglyceride subfractions of baseline, LFD and HFD-fed mice. (G) Body weight, (H) epididymal fat weight, (I) plasma insulin levels and (J) glucose tolerance test, inset: AUC for glucose tolerance test. Baseline n = 11, LFD = 10, HFD = 9. * p < 0.05, ** p < 0.001, *** p < 0.001.

