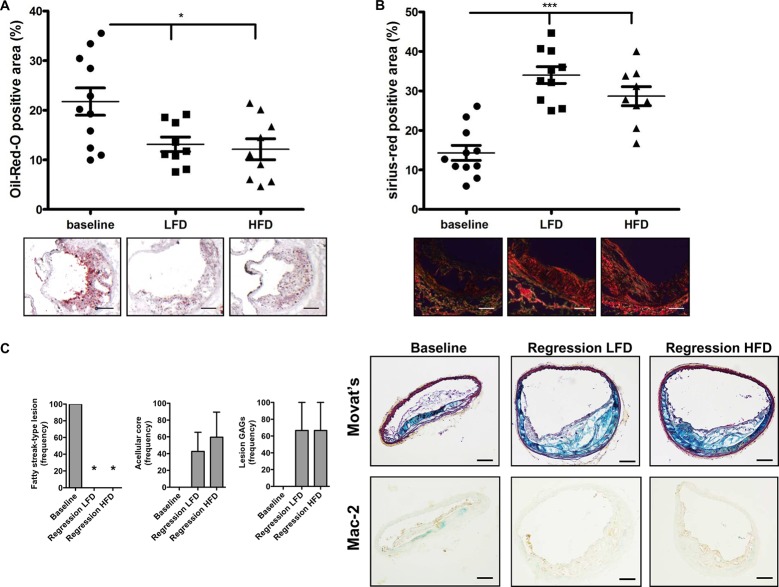
Fig 3. Atherosclerosis regression in mice fed a HFD versus LFD (II).
(A) Quantification of the Oil-Red-O positive area in the aortic sinus of baseline, LFD and HFD-fed mice. Representative pictures for each group are shown below. Bar = 200μm. (B) Quantification of sirius-red positive area of the aortic sinus, including representative pictures of en face aortas and in-site pictures (below). Bar = 200μm. Baseline n = 11, LFD = 10, HFD = 9. * p < 0.05, *** p < 0.001. (C) Assessment of atherosclerosis regression in brachiocephalic arteries. Representative pictures of Movat’s staining and Mac-2 staining are shown. n = 3/group. Bar = 100 μm

