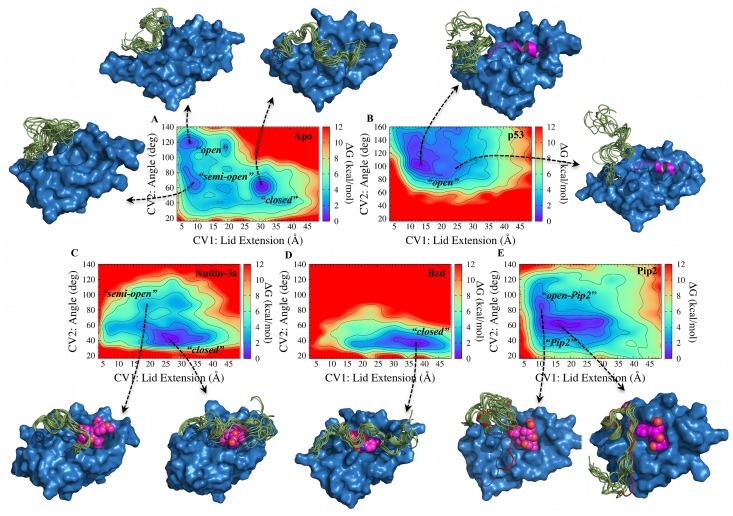
Fig 2. Ligand-dependent modulation of MDM2 lid free energy landscapes. CV1 (lid extension) in Å, and CV2 (lid-core angle) in degrees.
Free energy contours (kcal mol-1) are shown as a color coded heat map. Free energies are relative to the lowest free energy bin and are shown up to 12 kcal mol-1 above the lowest free energy bin. For every system, representative structures of MDM2 displaying 10 lid conformations from selected bins are shown. A) apo MDM2. B) p53-TAD(17–29)/MDM2 C) Nutlin-3a/MDM2 D) Bzd/MDM2 E) Pip2/MDM2. The lid conformation seen in the x-ray structure of MDM2 (6–125) reported by Michelsen et al. is shown in red cartoon representation [24].

