
Figure 2.
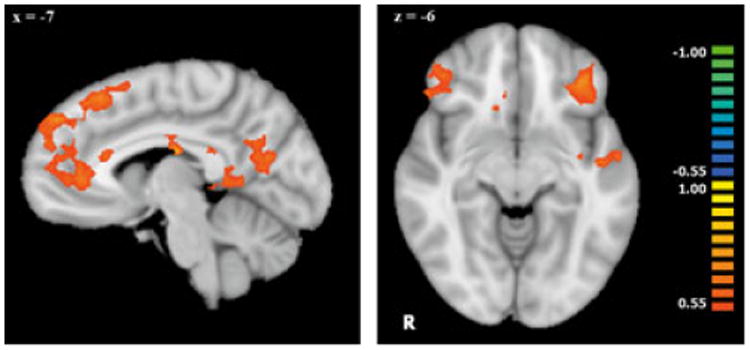
Whole-brain voxel-wise covariate analysis of activation to social exclusion > fair play that correlated with chronological age (n = 21). Data in these figures have been interpolated from 3 mm3 space to 1 mm3 space for visualization. All regions depicted showed a positive correlation between activation during exclusion and age (p < .01, k = 34). Regions of significant correlations are displayed on a Talairach-transformed template brain in radiological orientation.