
Figure 4.
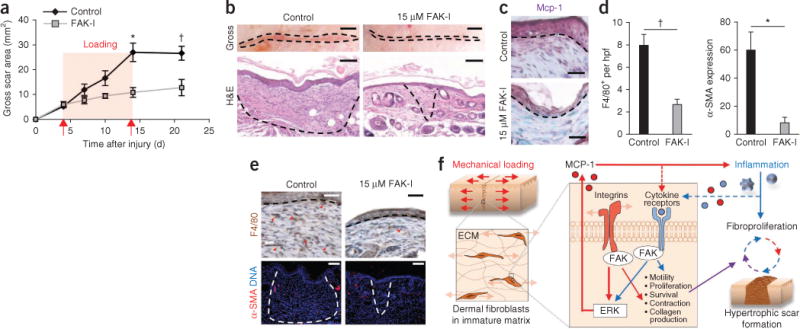
Intradermal treatment with PF573228. (a) Surface scar formation with treatment with 15 μM PF573228. n = 6. (b) Images of scars at day 10 after injury. The dashed lines indicate scar area. Scale bars, top row, 0.25; micrographs, 100 μm. n = 6. (c) Mcp-1 immunolocalization (purple color). The dashed lines indicate the basement membrane. Scale bars, 50 μm. (d,e) Quantification (d) and micrographs (e) of F4/80+ macrophages and α-SMA expression. n = 6. Scale bars, top row, 50 μm; bottom row, 100 μm. Values are means ± s.e.m. *P < 0.01, †P < 0.05. (f) Schematic of the proposed vicious cycle of hypertrophic scarring driven by mechanical activation of local and systemic fibroproliferative pathways through fibroblast FAK.