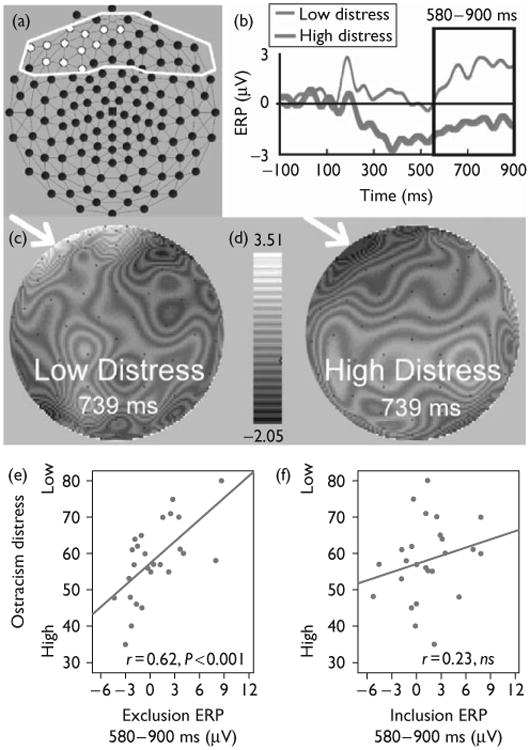
Fig. 2.

Event-related potential (ERP) waveforms, and scalp topography of social exclusion and relations with distress. (a) Frontal electrodes correlated with ostracism distress during exclusion events for an ERP slow wave, highlighted in white (principal component analysis-derived slow wave, 580–900 ms, false discovery rate controlled). (b) ERPs for the average of electrodes in (a), 10 least versus 10 most distressed participants. (c) Interpolated voltage map for low distress group. (d) Interpolated voltage map for high distress group. (e) Scatter plot of mean slow wave data for exclusion events and ostracism distress scores (n =27). (f) Scatter plot of mean slow wave data plotted for inclusion events during fair play and ostracism distress scores (n =27).
