
Fig. 2. Ski reverses TAZ-induced oncogenic transformation and EMT.
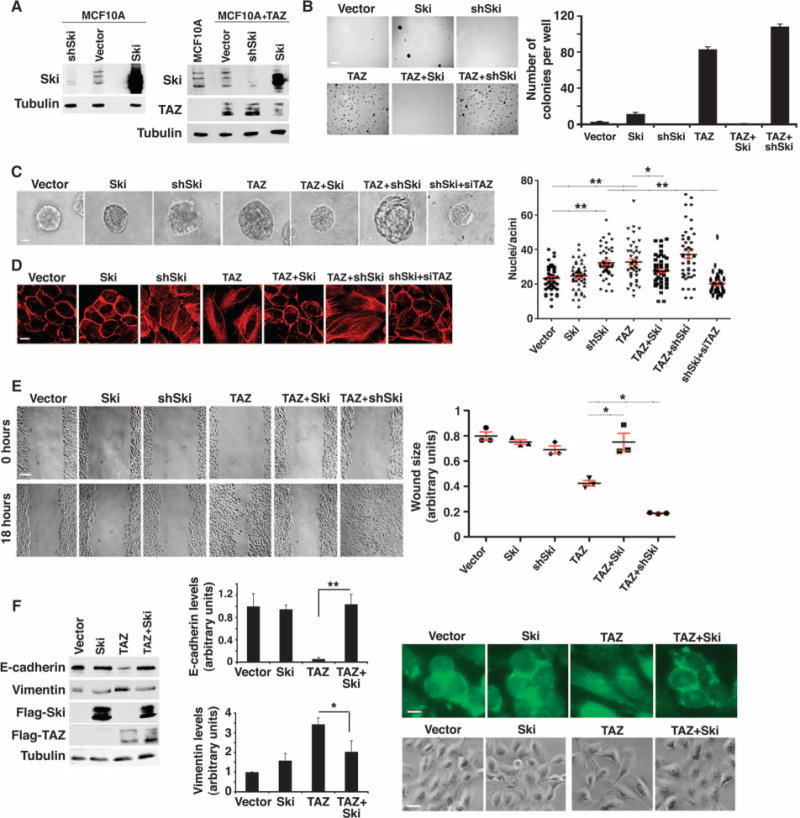
(A) Western blot analysis of Ski and TAZ abundance in MCF10A or MCF10A/TAZ cells stably infected with Ski cDNA or shSki. Western blots are representative of two independent experiments. (B) Ski blocked anchorage-independent growth induced by TAZ. Soft agar colonies formed by MCF10A cells stably expressing various cDNAs and shRNAs as indicated were stained and quantified. Data in the graph were derived from at least three independent experiments and are presented as means ± SEM [Student’s t test, *P < 0.05 (P value was calculated after colony counts were averaged and converted to logarithmic scale)]. Scale bar, 3 mm. (C) Phase-contrast images of 3D acini formed by MCF10A cells stably expressing various constructs as indicated. The size of an acinus was determined by the number of nuclei in each acinus. Forty acini from three independent experiments were quantified for each cell line and presented in the graph as means ± SEM [analysis of variance (ANOVA), Newman-Keuls multiple comparison test; *P < 0.05, **P < 0.01]. Scale bar, 40 μm. Significant differences between the control and shSki or TAZ cells and between shSki and shSki + TAZ siRNA (siTAZ) cells (**P<0.01) and between TAZ and Ski-TAZ cells (*P< 0.05) were detected. (D) Actin stress fiber formation was visualized by staining with rhodamine-conjugated phalloidin. Images are representative of three independent experiments. Scale bar, 20 μm. (E) Wound healing assay. Data in the graph were derived from at least three independent experiments and are presented as means ± SEM (ANOVA, Newman-Keuls multiple comparison test; *P < 0.05). Scale bar, 300 μm. (F) Ski reversed the effect of TAZ on the abundance of E-cadherin and vimentin as determined by Western blotting. Data in the graph were derived from at least three independent experiments and are presented as means ± SEM (Student’s t test, *P < 0.05 and **P < 0.01). The cell morphology (scale bar, 50 μm) and E-cadherin localization (scale bar, 20 μm) are shown in the panels to the right. Images are representative of three independent experiments.