
Fig 7. MGAS315 covS wt and MGAS315 ΔcovS have higher skin invasion than MGAS6180 and MGAS6180 ΔcovS, respectively.
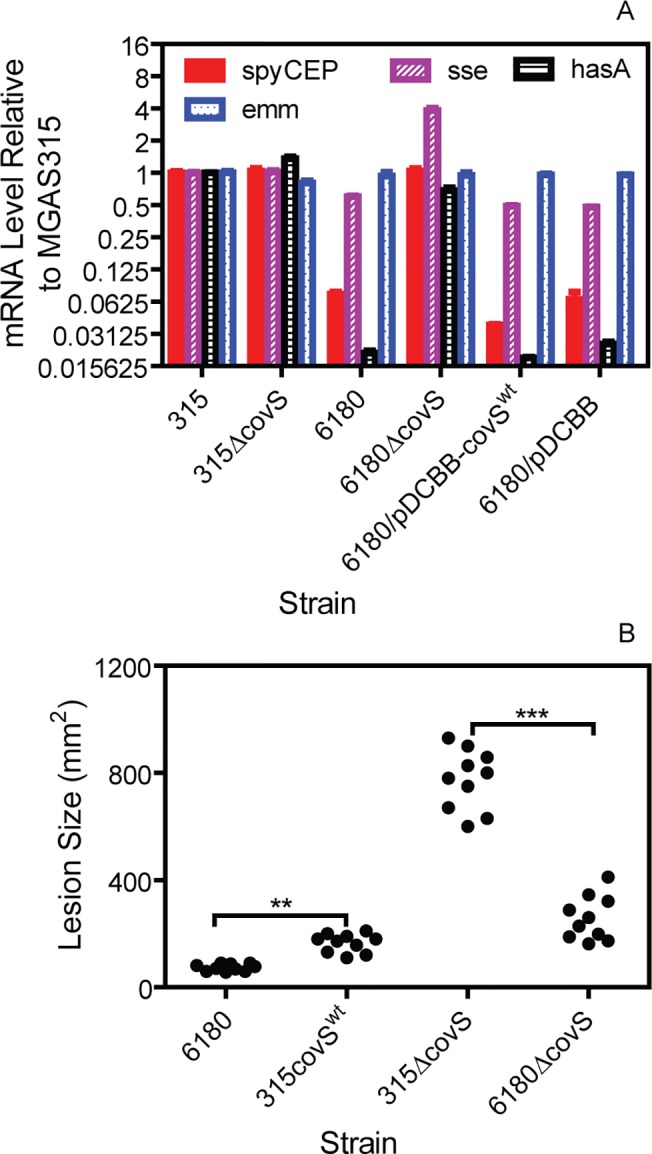
(A) Relative levels of hasA, spyCEP, sse, and emm transcripts in MGAS315, MGAS315 ΔcovS, MGAS6180, and MGAS6180 ΔcovS, MGAS6180/pDCBB-covS wt, and MGAS6180/pDCBB. All the mRNA levels were normalized first to that of gyrA and then to that of each gene transcript in MGAS315. (B) Lesion sizes in subcutaneous infections of mice at 24 h after inoculation after inoculation with 1.3 x 10⁸ cfu MGAS315 covS wt, 1.2 x 10⁸ cfu MGAS315 ΔcovS, 1.4 x 10⁸ cfu MGAS6180, and 1.3 x 10⁸ cfu MGAS6180 ΔcovS. Statistical analysis with the One-way ANOVA Newman-Keuls Multiple Comparison Test in panel B: **, P < 0.01 and ***, P < 0.001.