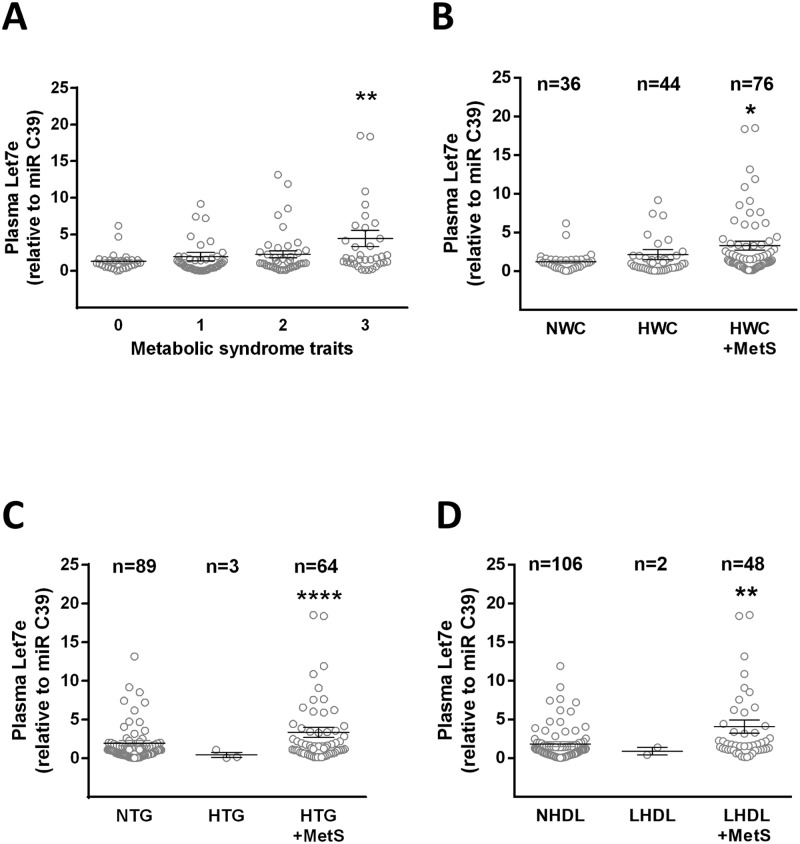
Fig 3. Plasma levels of Let-7e according to the presence of MetS traits.
(A) Plasma levels of Let-7e according to the number of MetS traits, or (B) the presence of altered waist circumference (HWC), (C) elevated plasma triglycerides (HTG) and (D) low HDL plasma levels (LHDL) in combination with one other MetS trait (+MetS). Values are mean ± SEM, * p < 0.05, **p < 0.01, ****p < 0.0001 vs. controls, ANOVA.

