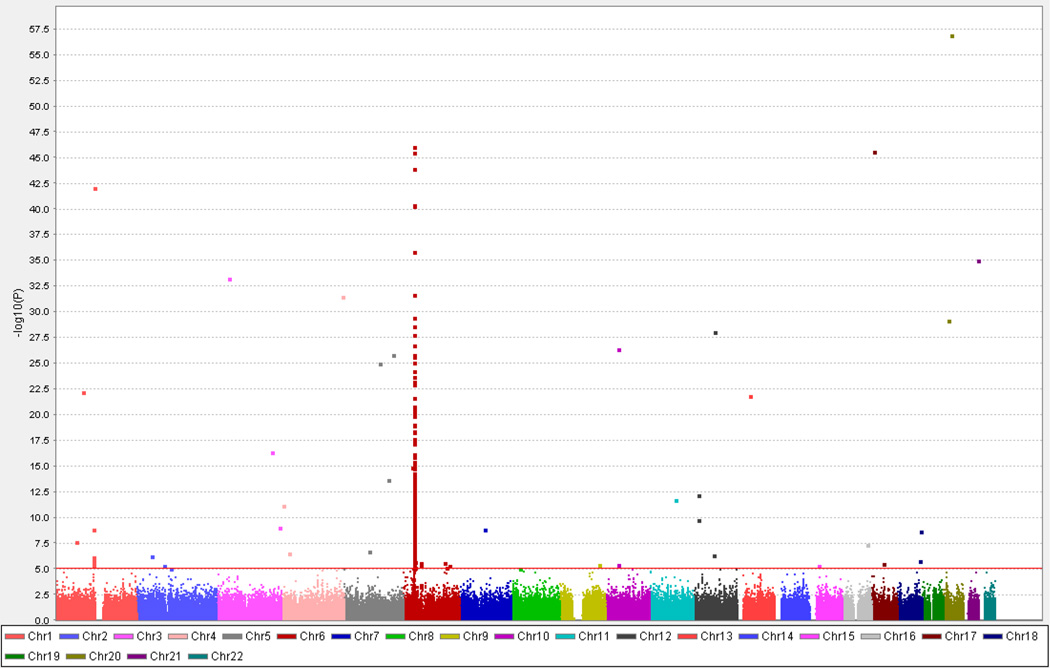
Figure 1.
Manhattan plot showing the results of the association analysis in the Discovery set. The X-axis shows the chromosomal location of the analyzed SNPs and the Y-axis shows the – log(p-value). As expected the strongest association was seen on chromosome 6 at the MHC (HLA) locus with many SNPs in this locus showing genome wide significance (p < 5×10⁻⁸); however, other non-MHC loci also showed significant associations.

