
Figure 2.
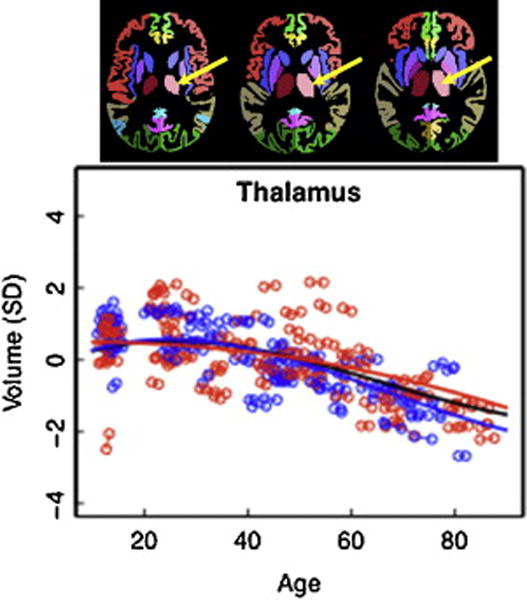
Modified from Pfefferbaum et al. (2013) NeuroImage Vol. 65: 176–193, Figures 1 and 4.
Top figure: Parcellated segmentation of the thalamus (depicted in light and dark pink) from the SRI24 atlas (http://nitc.org/projects/sri24).
Scatterplot: Volume of the thalamus, expressed as standardized residuals (Z-score) or standard deviations (SD), after correction for supratentorial volume of regional brain structures of the adult plus adolescent samples, with boys and men (blue) and girls and women (red) and best-fit functions over age for each sex. The black fit is the combined group irrespective of sex.