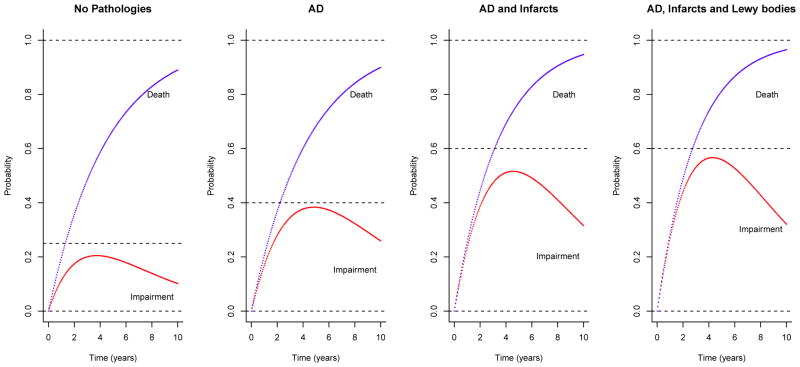
Figure 2.
illustrates estimated transition probabilities for persons with no common pathologies (Panel 1), AD only (Panel 2), AD and infarcts (Panel 3), and AD, infarcts and Lewy bodies diseases (Panel 4). The lower curves in each panel show the probabilities of transition from no impairment to cognitive impairment (mild and moderate combined) for a given time period (up to 10 years); and the upper curves show the cumulative transition probabilities from no impariment to impairment or death. The probabilities are shown for representative participants in the sample, that is, for females with 80 years old at baseline and with 15 years of education.

