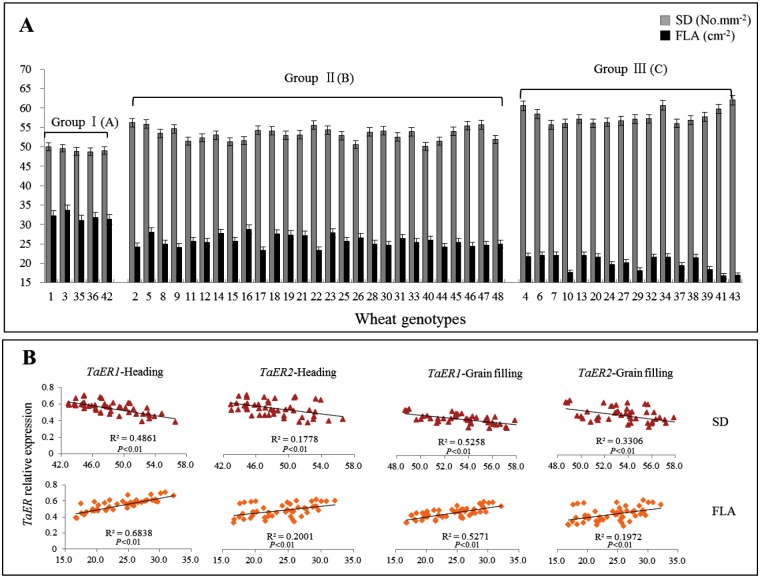
Fig 5. Correlation between TaER expression with SD of flag leaf and FLA.
A: Stomatal density (SD) of flag leaf and flag leaf area (FLA) of the 48 wheat genotypes; B: Regression analysis between TaER expression with SD of flag leaf and FLA. Group I: high TaER expression; Group II: intermediate TaER expression; Group III: low TaER expression. Uppercase letters represent significant differences among the three groups (P< 0.01).

