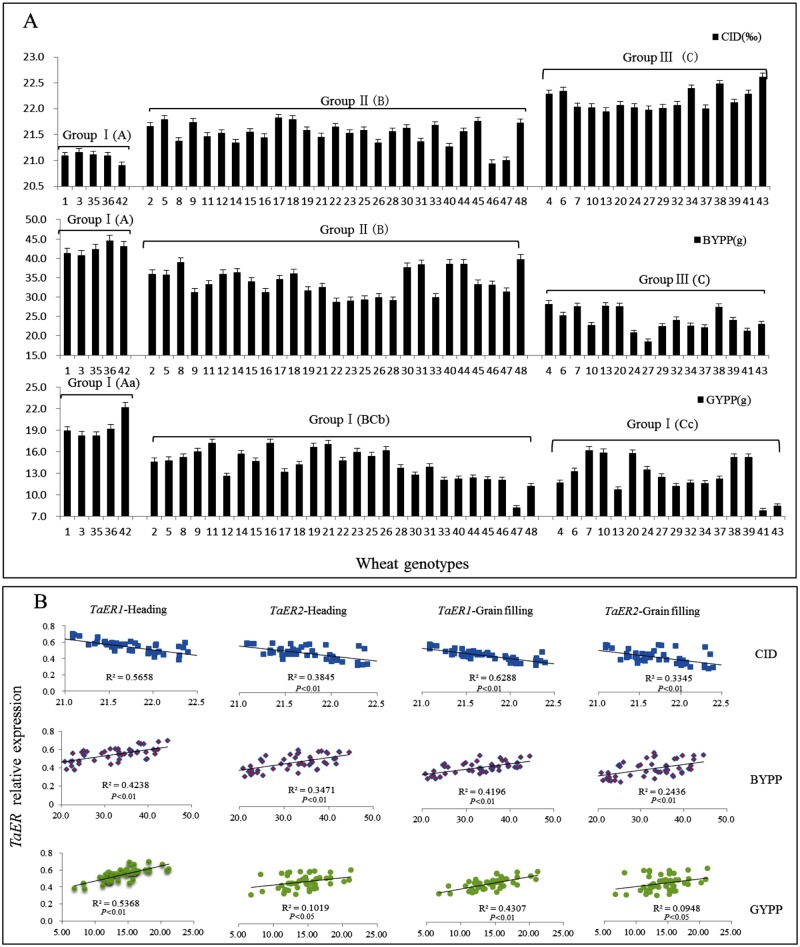
Fig 7. Correlation between TaER expression with CID, BYPP and GYPP.
A: Flag leaf carbon isotope discrimination (CID), biomass yield per plant (BYPP) and grain yield per plant (GYPP) of the 48 wheat genotypes; B: Regression analysis between TaER expression with CID, BYPP and GYPP. Group I: high TaER expression; Group II: intermediate TaER expression; Group III: low TaER expression. Upper and lowercase letters represent significant differences among the three groups (uppercase P< 0.01, lowercase P< 0.05).

