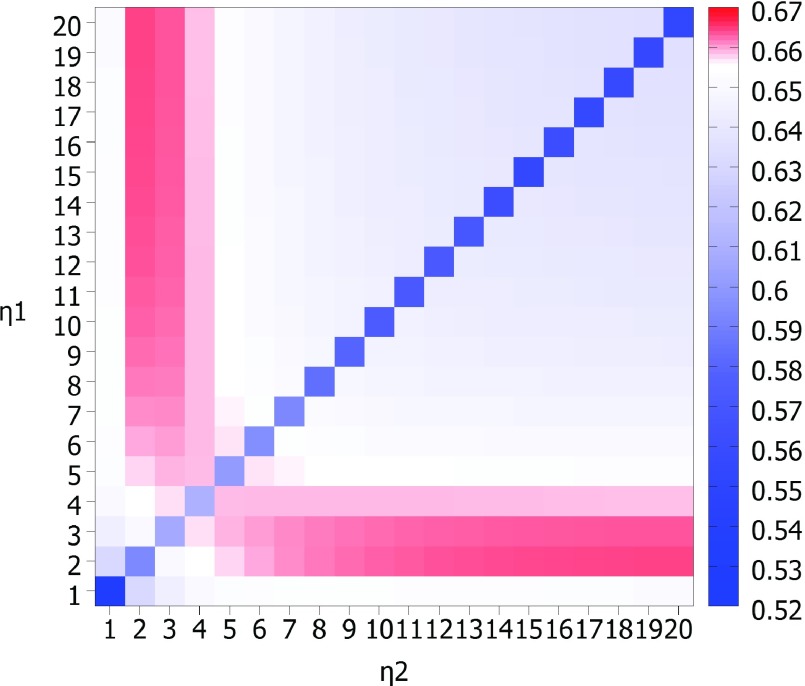
FIG. 1.
An illustration of multiscale behavior in protein flexibility analysis. Two Lorentz kernels (υ = 3) are used. Their scale values, η values, are listed along the horizontal and vertical axes. The mean correlation coefficient value for B-factor prediction on a set of 364 proteins is shown in each cell of the matrix and color coded for convenience with red representing the highest correlation coefficients and green the lowest. Obvious, the combination of a relatively small-scale kernel and a relatively large-scale kernel delivers best prediction, which indicates the importance of incorporating multiscale in protein flexibility analysis.

