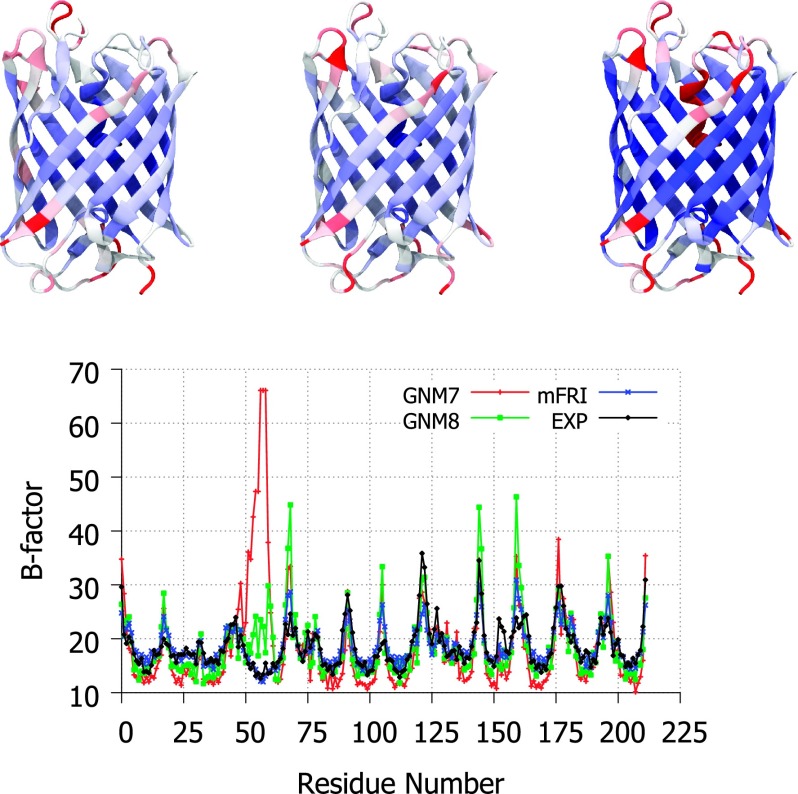
FIG. 3.
Top, a visual comparison of experimental B-factors (left), mFRI predicted B-factors (middle), and GNM predicted B-factors (right) for the engineered cyan fluorescent protein, mTFP1 (PDB ID:2HQK). Bottom, the experimental and predicted B-factor values plotted per residue. The GNM naming convention indicates the cutoff used for the GNM method in Å, i.e., GNM7 is the GNM method with a cutoff distance of 7 Å.

